Use the following diagrams for the U.S. economy to answer the next question.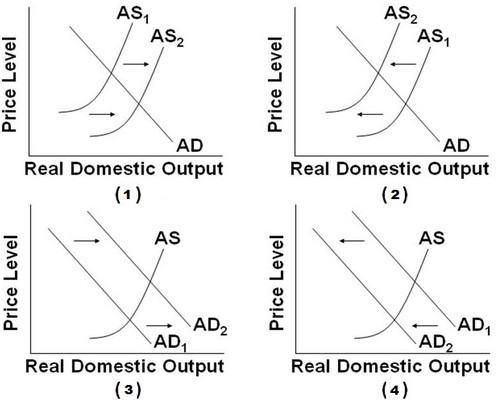 Which of the diagrams best portrays the effects of a substantial reduction in government spending?
A. Graph (1)
B. Graph (2)
C. Graph (3)
D. Graph (4)
Answer: D
You might also like to view...
The following government policies will help achieve faster economic growth EXCEPT
A) establishing and protecting property rights. B) improving the quality of education. C) discouraging saving and encouraging spending. D) encouraging research and development. E) increasing saving.
Economists use the concept of ________ to measure how one economic variable, such as quantity, responds to a change in another economic variable, such as price
A) elasticity B) slope C) relativity D) efficiency
The price elasticity of supply for Good A is equal to 0 . Fifty units of Good A are supplied when its price is $40.0 . If the price of Good A increases to $44.80, its supply will: a. decrease to 44 units
b. increase to 56 units. c. increase to 54 units. d. remain the same at 50 units.
In the long run the market supply
a. must always be horizontal. b. could be upward sloping if the cost of production falls as new firms enter the market. c. could be upward sloping if the cost of production rises as new firms enter the market. d. could be upward sloping if technological improvements lower the cost of producing in the market.