The text compares two studies on the profitability of slavery: one by Phillips and the other by Conrad and Meyer. The main reason for the difference in their results is:
a. Phillips failed to account for the effect of productivity gains in the concerned period.
b. Conrad and Meyer had better data on slave prices.
c. Conrad and Meyer used data from both northern and southern farms.
d. Phillips assumed that cotton prices were falling during the antebellum period.
a. Phillips failed to account for the effect of rising marginal product on profitability.
You might also like to view...
Use the following graph, where Sd and Dd are the domestic supply and demand for a product and Pc is the world price of that product, to answer the next question.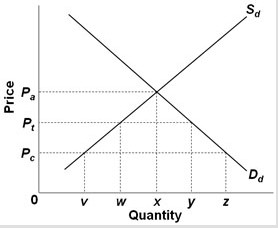 If the economy is opened to free trade, the price and quantity of this product sold would be
A. Pa and z. B. Pc and v. C. Pc and z. D. Pt and y.
Looking over the last six decades since 1950, how did the average U.S. unemployment rate during the 2000s compare to the other five decades?
What will be an ideal response?
The key financial institutions in the United States include all of the following EXCEPT
A) the U.S. Treasury B) the Federal Reserve C) commercial banks, pension funds, and insurance companies D) government-sponsored mortgage lenders
Refer to Figure 13-18. Which of the following statements is true?
A) Da represents the long-run demand curve facing a monopolistic competitor in a constant-cost industry while Db depicts the long-run demand curve in an increasing-cost industry. B) Da represents the long-run supply curve in a perfectly competitive, constant-cost industry while Db depicts the long-run demand curve facing a monopolistic competitor in a decreasing-cost industry. C) Da represents the long-run demand curve facing a perfect competitor while Db depicts the long-run demand curve facing a monopolistic competitor. D) Da represents the long-run demand curve facing a monopolistic competitor in a constant-cost industry while Db depicts the demand curve in the short run.