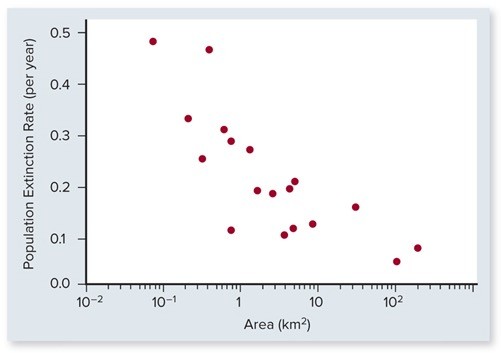
The following graph shows the relationship between extinction and habitat area. Which statements help explain the trend shown on the graph? Check all that apply. 
A. Larger patches are likely to have a more uniform habitat.
B. Species richness is higher on larger patches.
C. Larger patch size reduces genetic drift.
D. Larger patches are more likely to be encountered by new immigrants.
E. Larger patches are more geographically isolated than smaller patches.
Answer: D
You might also like to view...
Sutures can be classified as __________ joints
a. synovial b. immovable c. slightly movable d. freely movable e. cartilaginous
The choroid plexus functions to:
a. cushion the brain. b. control coordination of movement. c. produce the cerebrospinal fluid. d. transmit nerve impulses to specialized regions in the brain. e. divide the right and left hemispheres
The synthesis of a growing strand of DNA is carried out by adding nucleotides to the ________ end of an existing strand.
A. 5' B. 3' C. 2' D. 1'
The current classification system was devised by:
a. Aristotle b. Plato c. Linneaus d. Darwin