Exhibit 14-4 Aggregate supply and demand curves
?
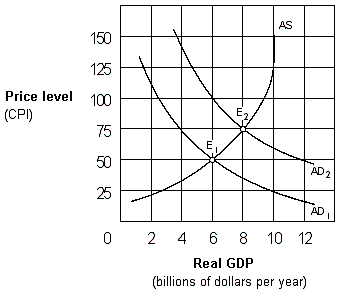
The increase in the price level as the economy moves from E1 to E2 in Exhibit 14-4 represents:
A. cost-push inflation.
B. demand-shock inflation.
C. wage push inflation.
D. demand-pull inflation.
Answer: D
You might also like to view...
Refer to Figure 7.1. Dudley values silence at
A) $100. B) $200. C) $350. D) $550.
Households and firms in the U.S. economy interact with those in the rest of the world in the ________ market and in the ________ market
A) goods; factor B) goods; financial C) government; goods D) financial; factor E) firm; government
Most college professors are granted tenure after six years of employment. Tenure implies a lifetime appointment. What problem does this situation create, and how can colleges minimize the problem?
What will be an ideal response?
"The costs and benefits for a country from joining a fixed-exchange rate area such as the EMS depend on how well-integrated its economy is with those of its potential partners." Discuss
What will be an ideal response?