Use the vertical line test to determine if the graphs are functions.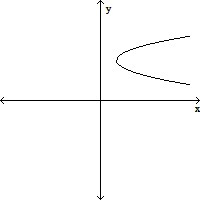
A. Yes
B. No
Answer: B
You might also like to view...
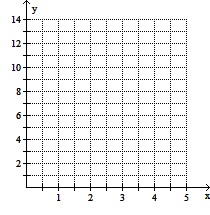
Determine whether the scatter diagram indicates that a linear relation may exist between the two variables. If a linear relation does exist, indicate whether the slope is positive or negative.Draw a scatter diagram of the given data. Find the equation of the line containing the points  and
and  Graph the line on the scatter diagram.
width="210" />
A. 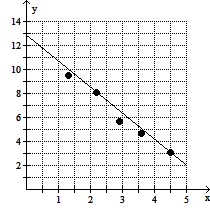
y = 2.17x + 12.88
B. 
y = -2.39x + 13.38
C. 
y = -2.17x + 12.88
D. 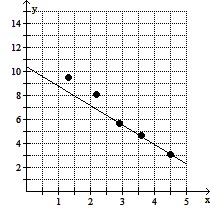
y = -1.62x + 10.41
Find the probability.A 6-sided die is rolled. What is the probability of rolling a number less than 2?
A. 
B. 
C. 
D. 
Use the given table to find the indicated probability.The following table contains data from a study of two airlines which fly to Smalltown, USA. P(flight was on Upstate Airlines
A. 
B. 
C. 
D. None of the above
Solve the problem.The given contingency table gives the number (in thousands) of U.S. households classified by educational attainment (high school graduate or less denoted with A, some college with no degree denoted B, an associate's degree denoted with C, and a bachelor's degree or higher denoted with D) and household income ($0 - $34,999 denoted with E, $35,000-$49,999 denoted with F, $50,000-$74,999 denoted G, and $75,000 and over denoted H).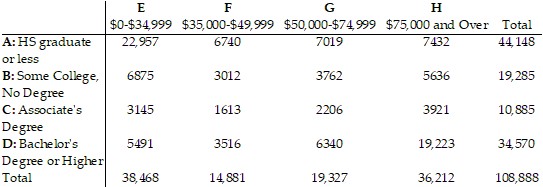 Find the number of households in the given set.C ? F'
A. 9272 B. 14,881 C. 10,885 D. 24,153