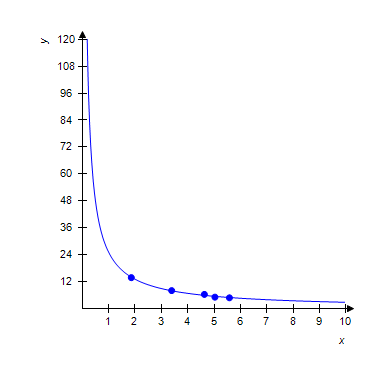
Plot the graph of the following data and add the graph of the power regression model. Round your answer to two decimal places.
x 1.86 3.39 4.63 5.03 5.58 y 13.94 8.18 6.49 5.27 4.97
What will be an ideal response?
?
-1.05
?
Mathematics
You might also like to view...
Find the solution set for each inequality. Graph the solution set on a number line and write it in interval notation.|4k - 8| - 9 > -6![]()
A.  ?
? 
![]()
B. 
![]()
C.  ?
? 
![]()
D. 
![]()
Mathematics
Solve.log3(x + 3) = -1
A. 
B. 
C. 
D. 
Mathematics
Give the domain and range of the relation.{(41, -3), (5, -2), (5, 0), (9, 2), (21, 4)}
A. domain: {41, 9, 5, 21}; range: {-3, -2, 2, 4} B. domain: {41, 9, 5, 21}; range: {-3, -2, 0, 2, 4} C. domain: {-3, -2, 2, 4}; range: {41, 9, 5, 21} D. domain: {-3, -2, 0, 2, 4}; range: {41, 9, 5, 21}
Mathematics
Use the formula for the sum of the first n terms of an arithmetic sequence.Find the sum of the first 40 terms of the arithmetic sequence: -9, -13, -17, -21, . . .
A. -3473 B. -3560 C. -3480 D. -169
Mathematics