In the above figure, what is total revenue at the profit-maximizing point?
A) $182
B) $126
C) $170
D) $176
A
You might also like to view...
If real money demand increases 5% and real money supply increases 10%, by about how much does the price level change?
A) Falls by 5% B) Unchanged C) Rises by 2% D) Rises by 5%
Based on the graph above, if the economy is at point 2, then (assuming no price shocks and no changes in actual and potential output) the inflation rate next period will be ________ percent
A) 5 B) 3.5 C) 4.5 D) 4 E) none of the above
An increase in the quantity demanded could be caused by:
a. an increase in the price of substitute goods b. a decrease in the price of complementary goods c. an increase in consumer income levels d. all of the above e. none of the above
Exhibit 21-5 International currency markets
?
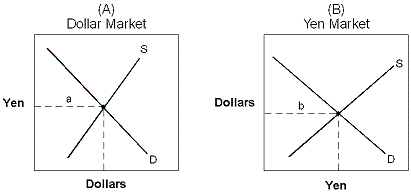 Exhibit 21-5 displays the international currency market for yen in terms of dollars and dollars in terms of yen. The supply curve in graph 15-5(A) is determined by:
A. U.S. citizens attempting to purchase Japanese-made goods. B. Japanese attempting to purchase U.S.-made goods. C. U.S. businesses attempting to sell to the Japanese. D. Japanese businesses attempting to sell to the U.S.