The pie chart below shows the number of pizzas consumed by college students in a typical month. Use the chart to answer the question. 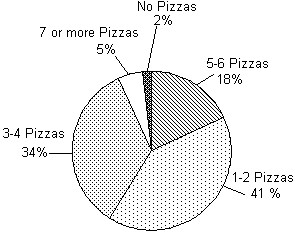 What percent of college students consume 3 or more pizzas in a typical month?
A. 34%
B. 57%
C. 98%
D. 52%
Answer: B
Mathematics
You might also like to view...
Determine if the series converges absolutely, converges, or diverges.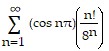
A. diverges B. converges absolutely C. converges conditionally
Mathematics
Identify which graph matches the equation.f(x) = (x + 2)2 + 3AB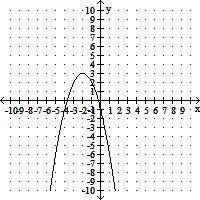 ?
?
A. Graph B B. Graph A
Mathematics
Determine if the pair of polar coordinates represents the same point.(4, 51°), (-4, -51°)
A. Yes B. No
Mathematics
Respond to the question by using complete sentences.Let p be a company's annual profit (in millions of dollars). What does p = -15 mean in this situation?
A. The company made $15. B. The company lost $15. C. The company made $15 million. D. The company lost $15 million.
Mathematics