Solve the problem.The following chart shows Tech Support Inc. monthly sales by region for each of the first six months of the year.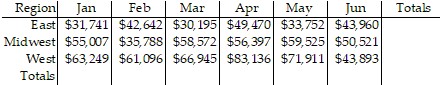
A. 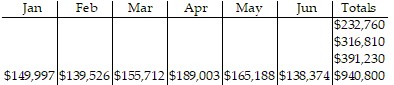
B. 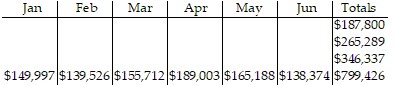
C. 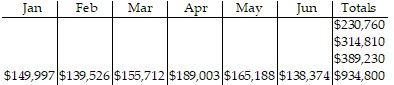
D. 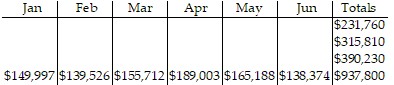
Answer: D
You might also like to view...
Write the negation of the conditional. Use the fact that the negation of p ? q is p ? ~q.If m - 4 ? 3, then m ? 7.
A. m - 4 ? 3 and m ? 7. B. m - 4 > 3 and m > 7. C. m - 4 ? 3 so m > 7. D. m - 4 ? 3 and m > 7.
Calculate the circulation of the field F around the closed curve C.F = x2y3i + x2y3j; curve C is the counterclockwise path around the rectangle with vertices at 

 , and
, and 
A. 108 B. 153 C. 9 D. 0
Construct an extended frequency distribution for the set of numbers and calculate the mean of the grouped data. Follow the instructions for class width.Use a class width of 100 beginning at 1000 (Hint: The first class is 1000 -1099.)108313751109168313681288106714251358163411971296115715791479139710621580124216851276139812471427114715681572148214311583
What will be an ideal response?
Write a percent proportion that could be used to answer the question. Do not solve. 22% of $65 is how much money?
A.  =
= 
B.  =
= 
C.  =
= 
D.  =
= 