If  , find
  .
.
A. 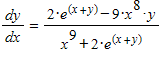
B. 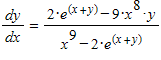
C. 
D. 
E. 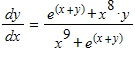
Answer: B
You might also like to view...
The stack plot below shows the value of each of Danny's investments. The stack plot contains three regions. The uppermost unshaded region represents the value of Danny's investment in individual stocks. The center shaded region represents the value of Danny's investment in mutual funds and the bottom region in black represents the value of Danny's investment in a CD. The thickness of a region at a particular time tells you its value at that time.  Use the graph to answer the question.In which year was the total value of Danny's investments the least?
A. year 0 B. year 3 C. year 1 D. year 8
Write the sum or difference as a product containing only sines and/or cosines.cos(6?) + cos(4?)
A. 2 cos(5?) sin ? B. 2 cos(5?) cos ? C. 2 cos(5?) D. 2 sin(5?) sin ?
Find the exact value of the expression using a sum or difference identity.cos 255°
A.  (
( - 1)
- 1)
B. - 
C. -  (
( - 1)
- 1)
D. 
Find the expected value.Mr. Cameron is sponsoring an summer concert. He estimates that he will make $300,000 if it does not rain and make $60,000 if it does rain. The weather bureau predicts the chance of rain is 0.34 for the day of the concert. An insurance company is willing to insure the concert for $150,000 against rain for a premium of $30,000. If he buys this policy, what are his expected earnings from the concert?
A. $180,000 B. $300,000 C. $270,000 D. $239,400