Refer to the graphs below. In Graph B, assume that the economy is initially in equilibrium at point x1 but then there is an increase in the price level from P1 to P2. In the long run, this change will lead to:
In the graphs below, QP refers to the economy's potential output level.
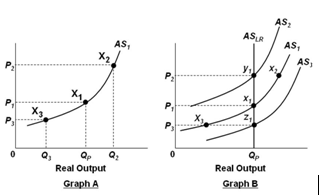
A. Lower nominal wages and a shift in the short-run aggregate supply curve from AS1 to AS2
B. Higher nominal wages and a shift in the short-run aggregate supply curve from AS1 to AS2
C. Lower nominal wages and a movement from equilibrium point x1 to equilibrium point x2
D. Higher nominal wages and a movement from equilibrium point x1 to equilibrium point x2
B. Higher nominal wages and a shift in the short-run aggregate supply curve from AS1 to AS2
You might also like to view...
The Balance of Payments
In the coordination failure model, a rightward shift in the labor supply curve
A) increases the real wage and increases employment. B) increases the real wage and decreases employment. C) decreases the real wage and increases employment. D) decreases the real wage and decreases employment.
Which of the following best defines the specialization of resources?
a. Workers are compensated as individuals. b. Special resources are needed to produce most goods. c. Each resource is paid for in full. d. Each resource is paid the most if it is specialized. e. Each resource is focused on a limited number of productive activities.
The so-called Great Recession in the U.S.:
A. Is another name for the Great Depression B. Was the worst economic downturn since the Great Depression C. Was triggered by oil-supply shocks D. Was caused by a sharp increase in the value of the U.S. dollar