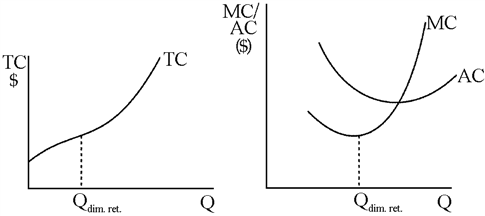
Graph typical total, average, and marginal cost curves and explain how their shapes are influenced by the law of diminishing returns. Graph TC on a separate graph, AC and MC on a second graph
TC rises slowly at first and then more quickly once diminishing returns set in (Figure 7-19). Marginal cost, which is the slope of total cost, will be positive but decreasing initially; it will increase at the point of diminishing returns. Average cost will fall at first but eventually will increase. The point of increase is at a larger level of output than the point of diminishing returns. Average cost continues to decline beyond the point of diminishing returns because, at least for a while, declining average fixed cost reduces AC by more than diminishing returns increase AC.
Figure 7-19
You might also like to view...
A perfect price discriminating monopoly
A) captures all consumer surplus. B) creates deadweight loss. C) increases market inefficiency. D) decreases total welfare.
The demand curve faced by a perfectly competitive firm is vertical
a. True b. False Indicate whether the statement is true or false
"The standard of living is too low for many individuals in the United States. The government should implement policies designed to achieve a more equal distribution of income." The preceding statements are
a. positive economic statements based on cause and effect. b. normative economic statements based on value judgments. c. based on the fallacy of composition argument. d. an empirically validated economic principle.
If a sandwich shop near campus increases its prices by 5 percent, but revenues from its sales are unchanged, the price elasticity of demand for the services offered by the sandwich shop must be
a. elastic. b. of unitary elasticity. c. inelastic. d. equal to 0.5.