Solve the problem.The following data represents the normal monthly precipitation for a certain city in California. 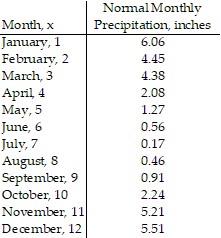 Draw a scatter diagram of the data for one period. Find a sinusoidal function of the form
  that fits the data. Draw the sinusoidal function on the scatter diagram. Use a graphing utility to find the sinusoidal function of best fit. Draw the sinusoidal function of best fit on the scatter diagram.
What will be an ideal response?
y = 3.14 sin (0.46x + 1.52) + 3.16
Mathematics
You might also like to view...
Write as a decimal. %
%
A. 25.00 B. 0.25 C. 0.0025 D. 0.0100
Mathematics
Follow the proper order of operations to evaluate the following.
A. - 142
B. - 
C. - 
D. - 139
Mathematics
Solve the problem.An element decays at the rate of S(t) = se-0.039t, where t is time in years and s is the initial size in grams. If you have a 89-gram piece of this element, how many grams will you have 4 years from now? Round your answer to the nearest tenth of a gram.
A. 42.8 g B. 104.0 g C. 0.9 g D. 76.1 g
Mathematics
Find the average rate of change illustrated in the graph. 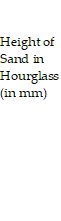
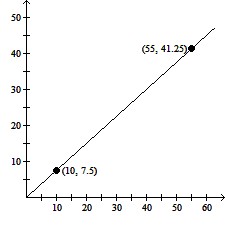
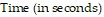
A. 1.3 mm per second B. .85 mm per second C. 1 mm per second D. .75 mm per second
Mathematics