The graph below shows demand and marginal cost for a perfectly competitive firm. If the firm is producing 300 units of output, decreasing output by one unit would ________ the firm's profit by ________.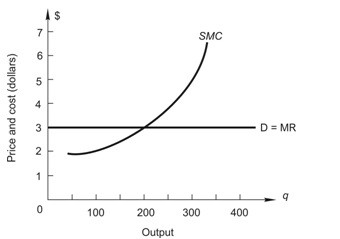
A. increase, $5
B. decrease, $5
C. decrease, $2
D. increase, $2
E. increase, $3
Answer: D
You might also like to view...
In the figure above, if the market is at equilibrium, then the total consumer surplus equals the area ________ and the total producer surplus equals the area ________
A) A; B B) B; C C) C; B D) A; C E) A + B; C
If the value of the marginal product of physical capital is $10 and the marginal product of physical capital is 5 units, the price of the finished good that the capital is used to produce is:
A) $1. B) $2. C) $5. D) $10.
Suppose that in a month the price of pizza increases from $4 to $5. At the same time, the quantity of pizzas demanded decreases from 200 to 190. The price elasticity of demand for pizza (calculated using the midpoint formula) is:
A. zero. B. inelastic. C. unit elastic. D. elastic.
Refer to the information provided in Figure 2.5 below to answer the question(s) that follow.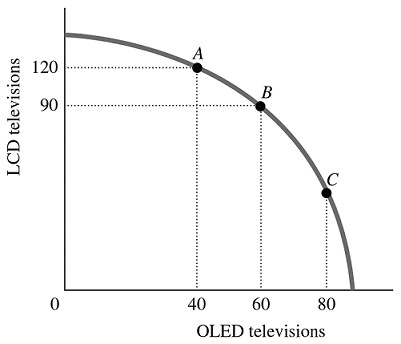 Figure 2.5Refer to Figure 2.5. The best point for society would be
A. either Point B or Point C, as the total amount being produced at either of these points is approximately the same. B. at any of the labeled points, as all of the points represent an efficient allocation of resources. C. Point C, as at this point there are approximately equal amounts of LCD and OLED televisions being produced. D. indeterminate from this information, as we don't have any information about the society's desires.