This graph represents the cost and revenue curves of a firm in a perfectly competitive market.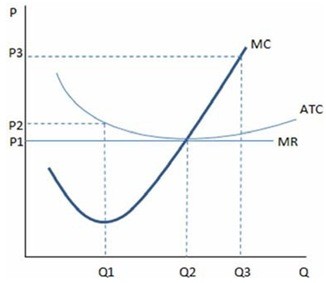 According to the graph shown, what is the market price?
A. P1
B. P2
C. P3
D. Cannot tell from the graph.
Answer: A
You might also like to view...
Real business cycle theory emphasizes the role of
A) government spending as a cause of economic fluctuations. B) shocks to the money supply as a cause of economic fluctuations. C) demand shocks as a cause of economic fluctuations. D) technology shocks as a cause of economic fluctuations.
Suppose the CPI for this year is 133.7. This number means that
A) on average, goods cost $133.70 each this year. B) prices rose 33.7 percent over the last year. C) prices rose 133.7 percent over the base year. D) prices rose 33.7 percent over the base year. E) prices rose 133.7 percent over the last year.
A dominant strategy is
A) a strategy chosen by two firms that decide to charge the same price or otherwise not to compete. B) a strategy that is the best for a firm no matter what strategies other firms use. C) a strategy that is obviously the best for each firm that is a party to a business decision. D) an equilibrium where each firm chooses the best strategy, given the strategies of other firms.
Stock options for corporate managers plays a part in handling the conflict between management and __________ in __________-oriented financial systems
A) bankers; markets B) bankers; banking C) stockholders; markets D) stockholders; banking