Use the following graphs to answer the next question.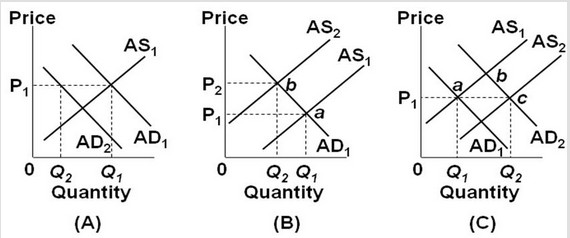 In the diagrams, AD1 and AS1 are the "before" curves. Assuming Q1 is full-employment output, an expansion is depicted by ________.
A. panel (A) only
B. panel (B) only
C. panel (C) only
D. panels (A) and (B)
Answer: C
You might also like to view...
Between 2001 and 2015, equilibrium college tuition rose from $15,000 to $27,000 and equilibrium enrollment increased from 16 million to 21 million students. These changes could be the result of
A) an increase in demand. B) an increase in supply. C) a decrease in demand. D) a decrease in supply.
If a manager of a firm believes one of their firm's suppliers is engaged in cartel activity, the manager ________ an incentive to report the behavior because they can ________.
A) has; have to pay whistle -blower fees B) does not have; receive treble damages C) has; receive treble damages D) does not have; have to pay whistle-blower fees
Bill uses his entire budget to purchase Pepsi and hamburgers, and he currently purchases no Pepsi and 6 hamburgers per week
The price of Pepsi is $1 per can, the price of a hamburger is $2, Bill's marginal utility from Pepsi is 2, and his marginal utility from hamburgers is 6. Is Bill's current consumption decision optimal? A) No, he should increase Pepsi consumption and reduce hamburger consumption. B) No, he should purchase more of both goods. C) Yes, the corner solution is best because his MRS is less than the price ratio. D) We do not have enough information to answer this question.
On a downward-sloping linear demand curve, total revenue reaches its maximum value at the
a. midpoint of the demand curve. b. lower end of the demand curve. c. upper end of the demand curve. d. It is impossible to tell without knowing prices and quantities demanded.