Figure 7-8
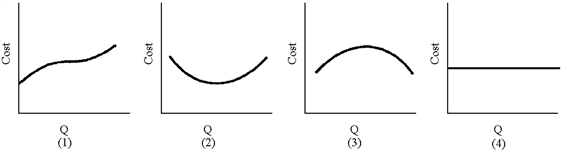
Of the graphs in Figure 7-8, which represents fixed cost?
a.
1
b.
2
c.
3
d.
4
d
You might also like to view...
A person keeps $500 in his home in order to be prepared for some unforeseen future event. This reflects his
A) speculative demand for money. B) asset demand for money. C) liquidity demand for money. D) precautionary demand for money.
An elasticity is a measure of sensitivity
Indicate whether the statement is true or false
The perfectly competitive firm shown in Figure 9-6 is currently producing 180 units of output. To maximize profit, it should
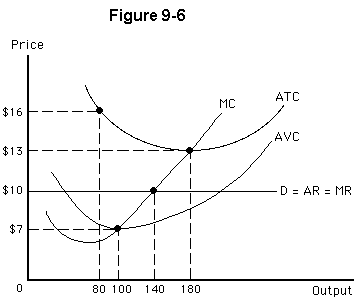
a.
increase output until ATC is maximized
b.
reduce output to 140 units
c.
reduce output to 100 units
d.
raise its price and lower its output
e.
raise its price and raise its output
One World View article titled "Global Depression" states, "The Great Depression wasn't confined to the U.S. economy." This implies that many other countries
A. Were producing inside their production possibilities curves. B. Experienced an increase in real GDP. C. Were producing on their production possibilities curves. D. None of the choices are correct.