According to the graph shown, if a firm is producing at Q2:
This graph represents the cost and revenue curves of a firm in a perfectly competitive market.
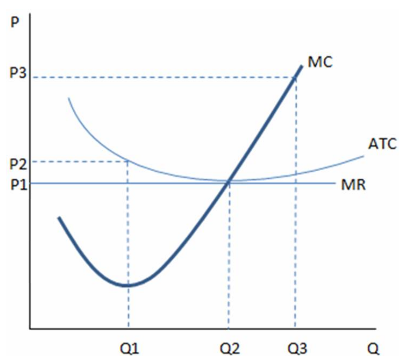
A. profits are being maximized.
B. average total costs are minimized.
C. it is producing at an efficient scale.
D. All of these are true.
D. All of these are true.
You might also like to view...
Independent, non-monopoly firms have an incentive advantage over monopolies in new-product innovation
Indicate whether the statement is true or false
Which of the following statements about a firm's demand curve for labor is true?
a. It shows the relationship between the price of output and the quantity of output demanded. b. It usually has a negative slope. c. It is perfectly inelastic. d. It is derived from the labor supply curve. e. It is parallel to the demand curve for the firm's product.
A point inside a production possibilities curve reflects
a. the law of increasing costs b. technological innovation c. less than full use of resources and technology d. economic efficiency e. a way to increase future economic growth
A network linking six users is typically:
A. less than three times as valuable as a network linking two users. B. three times as valuable as a network linking two users. C. less likely to exhibit bottlenecks than a network linking two users. D. more than three times as valuable as a network linking two users.