Which diagram in Figure 9.4 shows what happens to investment if the government decides to make housing cheaper by lowering interest rates?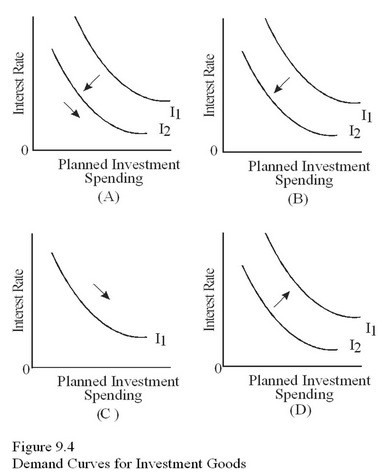 Which diagram in Figure 9.4 shows how investment responds to the expectation that the economy is about to go into a period of fast growth, causing firms to expect increased sales?
A. A.
B. B.
C. C.
D. D.
Answer: C
You might also like to view...
Starting from long-run equilibrium, an increase in autonomous investment results in ________ output in the short run and ________ output in the long run.
A. lower; potential B. higher; higher C. lower; higher D. higher; potential
Refer to the figure above. If the government of China wants to keep the exchange rate below E yuan per dollar:
A) it will have to buy dollar and sell yuan. B) it will have to buy yuan and sell dollars. C) it will have to buy both dollars and yuan. D) it will have to sell both dollars and yuan.
If the average product of labor curve is rising,
i. the average variable cost curve is falling. ii. the marginal cost curve is definitely falling. iii. the marginal product curve has reached its maximum. A) i and iii B) i only C) ii and iii D) i, ii, and iii E) ii only
Refer to the above table. At a price of $450, there is an
A) equilibrium. B) excess quantity supplied of 4,000 tablets. C) excess quantity demanded of 6,000 tablets. D) excess quantity demanded of 9,000 tablets.