Make a bar graph to represent the data.The following table shows the number of inches of rainfall measured at City X during the following days. Create a horizontal bar graph. 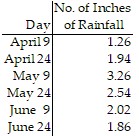
What will be an ideal response?
Answers may vary. The following is a possible answer.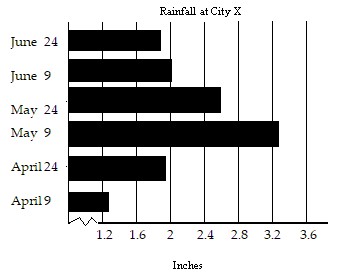
Mathematics
You might also like to view...
Find the limit. sec-1 x
A. - 
B. 
C. ?
D. 0
Mathematics
Solve the formula for the specified variable.I =  ; for n
A. n = 
B. n = 
C. n = 
D. n = IR(Ir - E)
Mathematics
Solve the problem.A coil of wire rotating in a magnetic field induces a voltage given by 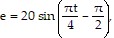 where t is time in seconds. Find the smallest positive time to produce a voltage of 10
 .
.
A. 3.33 sec B. 3? sec C. 3 sec D. 3.33? sec
Mathematics
Evaluate the exponential expression. 172
A. 19 B. 289 C. 1 D. 34
Mathematics