Make a bar graph to represent the data.The following table shows the number of female infants born at Hospital X on New Year's Day (Jan. 1). Create a vertical bar graph.
What will be an ideal response?
Answers may vary. A possible answer follows.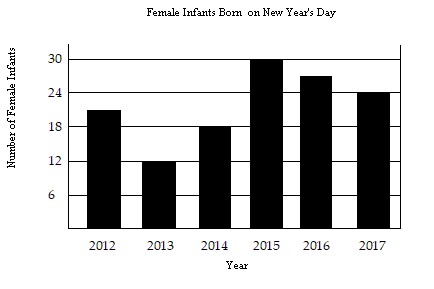
Mathematics
 ÷
÷ 


 %
%


 +
+ 


