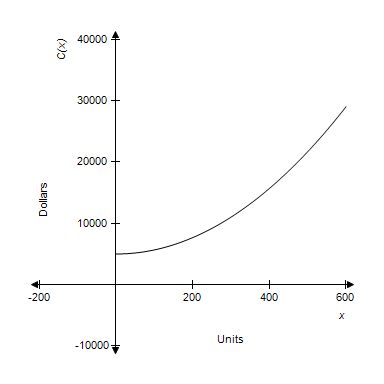
The graph of a company's total cost function is shown. Does this total cost function represent a manufacturing process that is getting more efficient or less efficient as the production level increases?
?
?
A. less efficient
B. more efficient
Answer: A
You might also like to view...
Evaluate the expression, given x = -2, y = 3, and a = -4.(-5 + x)(7 + y)(9 - a)
A. 910 B. -150 C. -910 D. -350
Use the laws of exponents to simplify. Do not use negative exponents in the answer. Assume that even roots are of nonnegative quantities and that all denominators are nonzero.(32k5m-10)1/5
A. 2km2
B. 
C. 5km2
D. 
Solve the problem.During the 1998-1999 Junior Hockey League season, the Sharks played 48 games. Together, their wins and losses totaled 43. They tied 9 fewer games than they lost. How many games did they win that season?
A. 25 games B. 29 games C. 5 games D. 14 games
Solve the problem.A football team gained 29 yards on one play, lost 11 yards on another, and gained 34 yards on the last play of the first half. They had already gained 320 yards during the half. What was the total yardage gain for the first half?
A. 394 yards B. 268 yards C. 372 yards D. 383 yards