Use the graph to answer the question.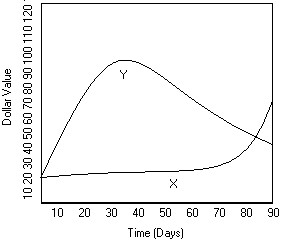 Mike decides to buy shares of companies X and Y, which were initially selling for the same price. The changes in each stock's value over 90 days are shown in the graph above. At day 90, Mike decides to buy more of one of the stocks. Which stock should he choose?
A. X
B. Y
Answer: A
You might also like to view...
Write the percentage as a fraction or decimal, as indicated.Write as a decimal.46%
A. 0.35 B. 4.6 C. 0.046 D. 0.46
Find the value. Give an approximation to four decimal places.ln 0.984
A. 0.0070 B. 0.0161 C. -0.0161 D. -0.0070
Solve the problem.Tides go up and down in a 12.4-hour period. The average depth of a certain river is 11 m and ranges from 8 to 14 m. The variation can be approximated by a sine curve. Write an equation that gives the approximate variation y, if x is the number of hours after midnight if high tide occurs at 8:00 am.
A. y = 11 sin ( -
-  )
)
B. y = 3 sin ( -
-  )
)
C. y = 3 sin ( -
-  )
)
D. y = 11 sin ( - 8?)
- 8?)
Write each whole number in standard form.Thirty-two thousand, nine hundred five
A. 32,950 B. 3,295 C. 32,905 D. 320,905