Draw a bar graph based on data provided. A manager in the food industry has to predict future consumption of major food commodities. The following are the data:
 figure 1.png)
A) Cheese
Mathematics
You might also like to view...
Solve the problem.A cylindrical paint can is 3 inches across the top and about 10 inches high. How many cubic inches of paint could it hold (to the nearest hundredth)?
A. 188.40 in.3 B. 70.65 in.3 C. 141.30 in.3 D. 282.60 in.3
Mathematics
Find the domain and range of the function represented in the graph.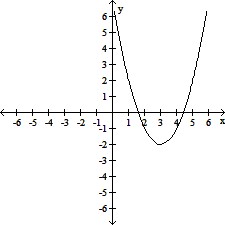
A. Domain: (-?, ?); Range: [-2, ?) B. Domain: [3, ?); Range: [-2, ?) C. Domain: (-?, 3) or (3, ?); Range: (-?, -2) or (-2, ?) D. Domain: (-?, ?); Range: (-?, ?)
Mathematics
Simplify.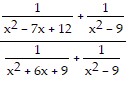
A. 
B. 
C. 
D. 
Mathematics
Find the book value using the MACRS method of depreciation and the MACRS depreciation rates table. Round to the nearest dollar.MACRS Depreciation Rates 
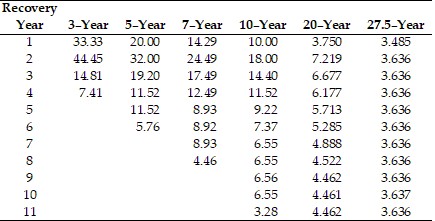 Cost: $400,000Recovery Period: 10-yearAfter: First Year
A. $360,000 B. $302,040 C. $342,840 D. $328,000
Mathematics