Use the information given to draw a bar graph. Clearly label the bars. The following table shows the average amount spent per week on groceries by four different families. Make a vertical bar graph to illustrate the data.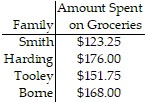
What will be an ideal response?
Answers may vary. The following is a possible answer.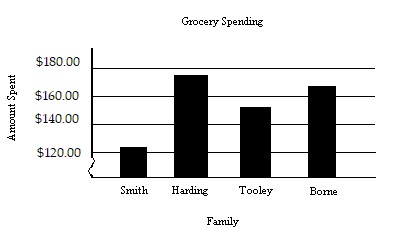
Mathematics
You might also like to view...
Consider the points plotted in the graph below. Give the coordinates for point B.
A. (4, -3) B. (-5, 4) C. (3, 4) D. (-3, 4)
Mathematics
Solve the problem.A can has a surface area of 841 square inches. Its height is 5.80 inches. What is the radius of the circular top? Round to the nearest hundredth.
A. 9.03 inches B. 23.08 inches C. 4.44 inches D. 11.56 inches
Mathematics
Use positive rational exponents to rewrite the expression. Assume variables are positive.
A. (y - 6)1/3
B. (y - 6)1/2
C. 
D. y1/3 - 61/3
Mathematics
Factor the four-term polynomial by grouping.10a3 - 12a2b + 15ab2 - 18b3
A. (10a2 + 3b2)(a - 6b) B. (2a2 - 3b2)(5a + 6b) C. (2a2 + 3b2)(5a - 6b) D. (2a2 + 3b)(5a - 6b)
Mathematics