Based on the description of a dose-response curve given in the text, you would expect the curve for arsenic
A. would show that arsenic is beneficial to humans when consumed in low quantities, but toxic at high quantities.
B. was a major factor in setting the new, lower drinking-water standard for dissolved arsenic of 10 ppb in public water supplies.
C. would show that microorganisms can be very helpful in decontaminating a site with high arsenic levels.
D. would show no benefit to low concentrations and great harm from high concentrations.
Answer: D
You might also like to view...
The flow of charge in a circuit depends on
A. a potential difference. B. adequate chemical action. C. adequate resistance. D. all of the above
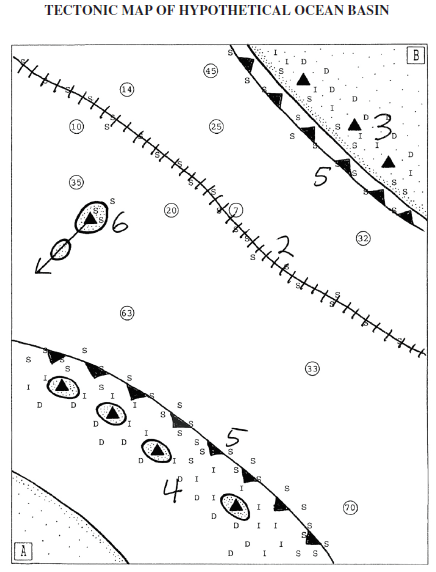
How many different plates (not boundaries) are clearly shown on the map?
After drawing in the plate boundaries using the appropriate symbols on the tectonic map below, answer the question above. When asked to cite evidence to support your answers, only cite evidence that you can see on this map.

Scale: 1 cm = 300 km 11 inch = 500 miles2
Why is wind erosion relatively more effective in arid regions than in humid areas?
What will be an ideal response?
Minimills are more likely than integrated steel mills to select locations because of access to
A) government subsidies. B) unskilled labor. C) markets. D) raw materials. E) fluid capital.