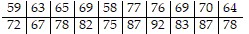
Write the best-fit linear model for the data.Managers rate employees according to job performance and attitude. The results for several randomly selected employees are given below. Find the linear function to model this data. 
A. y = -47.3 + 2.02x
B. y = 2.81 + 1.35x
C. y = 11.7 + 1.02x
D. y = 92.3 - 0.669x
Answer: C
You might also like to view...
Use inductive reasoning to find the next equation in the pattern.2 - 1 = 13 - 2 = 15 - 3 = 28 - 5 = 3
A. 13 - 8 = 5 B. 11 - 3 = 8 C. 10 - 5 = 5 D. 13 - 5 = 8
Provide an appropriate response.Change  to a repeating decimal.
A. 0.77777778
B. 0.77777777
C. 0.
D. 
Sketch the graph of the function and its inverse on the same coordinate axes.f(x) = 2 - x2, x ? 0
A. 
B. 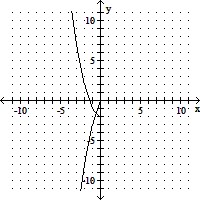
C. 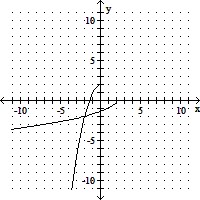
D. 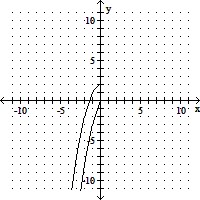
The following comparison line graph indicates the number of vehicles sold for a seven week period by two different salespeople. Use the graph to answer the question. How many more vehicles did Chris sell in the first week than did Pat sell in the first week?
A. 4 vehicles B. 3 vehicles C. 6 vehicles D. 2 vehicles