Refer to the labor market diagrams. The tactics of inclusive unionism are shown in Figure(s):
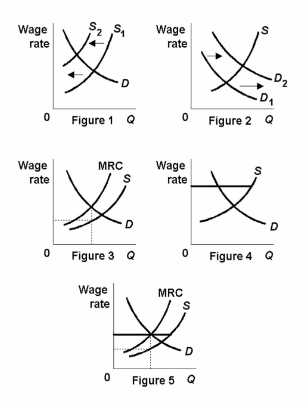
A. 5 only.
B. 3 only.
C. 4 and 5.
D. 1 and 2.
C. 4 and 5.
You might also like to view...
The table above shows the production possibilities for an economy
Drawing a PPF with books on the vertical axis and bread on the horizontal axis, a movement from possibility B to possibility C to possibility D shows the opportunity cost of ________ moving down along the PPF. A) books decreasing B) bread decreasing C) bread increases D) books is constant E) books and bread are both increasing
The excess burden of a tax
A) is measured by the administrative costs required to implement a tax system. B) is a measure of the foregone consumption as a result of having to pay taxes. C) is a measure of the hardship imposed on low-income individuals in a society. D) measures the efficiency loss to the economy that results from a tax, causing a reduction in the quantity of goods and services produced.
A firm that wishes to maximize profits will continue to hire labor until the
A) real wage = MPL. B) nominal wage = MPL. C) nominal wage = the real wage. D) nominal wage = the price level.
Figure 5-13
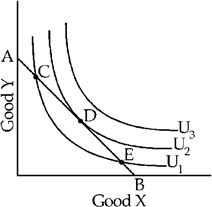
According to Figure 5-13, if the price of good X falls, a consumer making her optimal decision will move from a point on
a.
U1 to a point on U3.
b.
U2 to a point on U3.
c.
U1 to a point on U3.
d.
U2 to a point on U1.