Which graph most accurately shows changes to biodiversity as a function of latitude?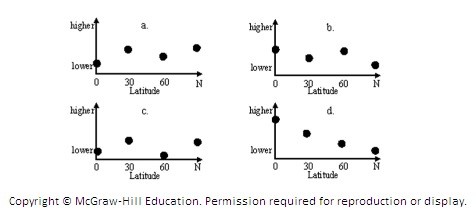
A. Graph a
B. Graph b
C. Graph c
D. Graph d
Answer: D
You might also like to view...
Which of the following statements accurately compares how air density and air pressure decrease as atmospheric altitude increases?
A. Air density decreases much less than air pressure decreases. B. Air density decreases much more than air pressure decreases. C. Air density decreases in much the same way as air pressure decreases. D. Air density decreases in a completely different way than air pressure decreases.
A mineral that is light colored, transparent, and fractures rather than cleaves is
A) garnet. B) quartz. C) biotite. D) muscovite. E) feldspar.
What is an ophiolite a result of?
a. Divergent plate boundaries b. Portions of continental crust squeezed and sheared onto the face of the continent c. Parts of oceanic crust obducted onto the edges of continents d. Continent to continent convergent boundaries
Dendrochronology involves the examination of annual _______________. (two words)
Fill in the blank(s) with correct word