Use the following graph to answer the next question.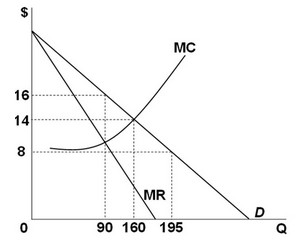 If the industry were perfectly competitive, the quantity of output produced would be ________.
A. 195
B. 160
C. 90
D. a level that is not labeled in the graph
Answer: B
You might also like to view...
Data for an economy show that the unemployment rate is 6 percent, the participation rate is 60 percent, and 200 million people 16 years or older are not in the labor force. How many people are in the working-age population in this economy?
A. 333 million B. 500 million C. 1.20 billion D. 800 million
If slope = 2 for a line on a graph with x on the horizontal axis and y on the vertical axis, then if
a. x decreases by 4, y decreases by 8 b. x = -4, then y = -2 c. y decreases by 4, x decreases by 8 d. x = -4, y = -8 e. x increases by 4, y decreases by 8
In 2011, the average American paid approximately how much to the federal government in taxes?
a. $2,000 b. $2,500 c. $8,000 d. $10,500
If the consumption schedule shifts downward, and the shift was not caused by a tax change, then the saving schedule:
A. May shift either upward or downward B. Will shift downward C. Will shift upward D. Will not shift