The growth rate of real GDP is best represented as
A) (Contribution from capital) + (Contribution from labor) + (Contribution from total factor productivity)
B) (Contribution from capital + Contribution from labor) / (Contribution from total factor productivity)
C) (Contribution from total factor productivity) / (Contribution from capital + Contribution from labor)
D) (Contribution from capital) × (Contribution from labor) × (Contribution from total factor productivity)
A
You might also like to view...
Refer to Figure 2-6. If the economy is currently producing at point D, what is the opportunity cost of moving to point B?
A) 60 thousand spoons B) 0 forks C) 16 thousand spoons D) 46 thousand forks
If the cost of production of the firms in a perfectly competitive market differs the resulting long-run supply curve will be an upward rising step function
Indicate whether the statement is true or false
The data points on a supply curve come from
A) survey analysis. B) the same place from which we get the data points on a demand curve. C) the supply schedule. D) companies' annual reports.
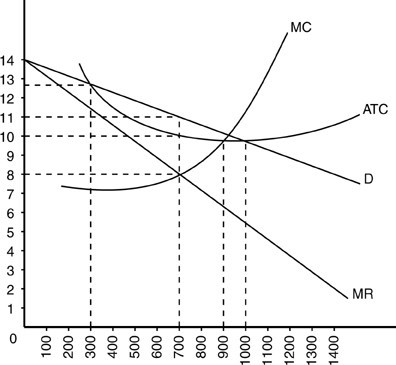 In the above figure, the monopolistically competitive firm's profit-maximizing output is
A. 300 units. B. 900 units. C. 1,000 units. D. 700 units.