The following comparison line graph indicates the number of vehicles sold for a seven week period by two different salespeople. Use the graph to answer the question. During what week did Chris sell the most number of vehicles?
A. Week 3
B. Week 7
C. Week 1
D. Week 5
Answer: C
Mathematics
You might also like to view...
Solve the problem.Write an equivalent statement using the distributive property.4 + 13
+ 13 =
=
A. 

B. 

C. 

D. 

Mathematics
Find  .e3y = cos (6x +y)
A. 
B. 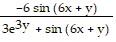
C. ln cos (6x + y)
D. 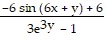
Mathematics
The number of cars sold weekly by a new automobile dealership grows according to a linear growth model. The first week the dealership sold two cars (P0 = 2). The second week the dealership sold six cars (P1 = 6).In the first 50 weeks the dealership sold a total of
A. 4996 cars. B. 5000 cars. C. 2000 cars. D. 5004 cars. E. none of these
Mathematics
Translate to an algebraic expression.Alex had y dollars before spending $39.50 for a book. How much did he have after the purchase?
A. $39.50y B. $39.50 + y C. $39.50 - y D. y - $39.50
Mathematics