The circle graph shows the results of the student council presidential election. The complete circular area represents 100% of the votes.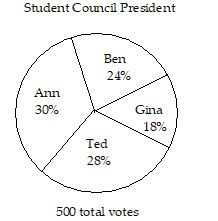 The circle graph shows what percent of the vote each person received.How many votes did Ann get?
A. 140
B. 120
C. 90
D. 150
Answer: D
You might also like to view...
The following table shows the stopping distance D, in feet, for a car that is traveling at a speed of S miles per hour. Use power regression to model the stopping distance as a function of the speed. Use two digits of accuracy for the coefficient and for the power. S 25 35 40 60 75 D 86 131 164 301 439?
A. ?
B. 
C. ?
D. ?
Determine the required number of branches in the tree diagram described.A tree diagram showing how many ways a nickel, a dime, and a quarter could be flipped
A. 8 B. 12 C. 3 D. 6
Determine whether or not the given display is skewed. If it is skewed, state the direction of the skew. 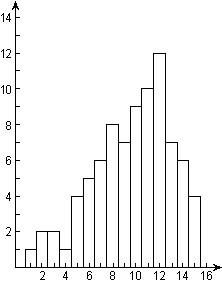
A. The distribution is not skewed. B. The distribution is skewed to the left. C. The distribution is skewed to the right.
Graph the hyperbola. -
-  = 1
= 1
A. 
B. 
C. 
D.