Refer to the information provided in Figure 2.4 below to answer the question(s) that follow.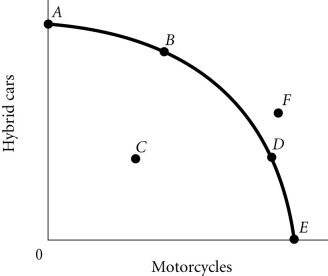 Figure 2.4According to Figure 2.4, a decrease in unemployment may be represented by the movement from
A. B to A.
B. C to D.
C. B to D.
D. A to C.
Answer: B
You might also like to view...
What makes the supply of U.S. dollars change?
What will be an ideal response?
Over the past year, productivity grew 2%, capital grew 1%, and labor grew 1%. If the elasticities of output with respect to capital and labor are 0.2 and 0.8, respectively, how much did output grow?
A) 1% B) 2% C) 3% D) 4%
A supply schedule is characterized by which of the following?
(A) It shows the quantity supplied at only one price. (B) It lists supply for a specific good. (C) It is sensitive to changes in the costs of labor and parts. (D) It shows the factors that could influence supply.
The supply function for good X is given by Qxs = 200 + 4PX - 3PY - 5PW, where PX is the price of X, PY is the price of good Y and PW is the price of input W. If PX = 500, PY = 250, PW = 30, then the supply curve is
A. Qxs = 1300. B. Qxs = -700 + 4Px. C. Qxs = 150 + 4Px. D. Qxs = -550 + 4Px.