Evaluate the function for the indicated input and interpret the result.The table lists the number of persons voting in an election by election year and sex, for a small community. 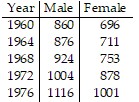 Let this table be a partial numerical representation of a function f, where
  computes the number of persons who voted in the year x whose sex is y. Evaluate
  Interpret the result.
A. f (1972, Male) = 1011
The number of males who voted in 1972 was 1011.
B. f (1972, Male) = 876
The number of males who voted in 1972 was 977.
C. f (1972, Male) = 1004
The number of males who voted in 1972 was 1004.
D. f (1972, Male) = 1011
The number of people who voted in 1972 was 1011, all male.
Answer: C
You might also like to view...
Graph the inequality.y > 8 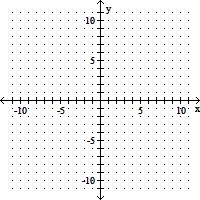
A. 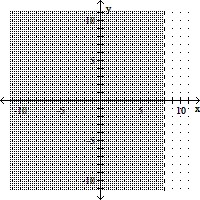
B. 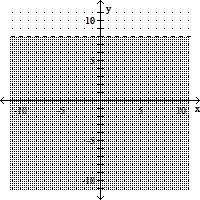
C. 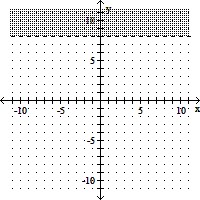
D. 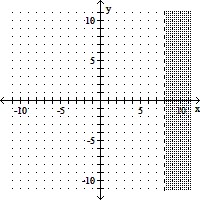
Provide an appropriate response.The payoff table for three possible courses of action A1, A2, and A3 is given below.pi?A1xi?A2xi?A3xi?.3$70$40$50.2$100$120$110.1$160$140$90.4$80$140$160Which course of action will produce the largest expected value? What is it?
What will be an ideal response?
Use a graphing calculator to approximate the real zeros of the function defined by f(x). Express decimal approximations to the nearest hundredth.f(x) = x4 + 9.63x3 + 43.35x2 + 104.51x + 101.81
A. -3.12 B. -3.12, 2.51 C. -3.12, -2.51 D. No real zeros
Find the distance between P and Q.P(5, 3), Q(-2, -3)
A. 42
B. 
C. 1
D. 