The graph in Figure 53-1 would best be described as:
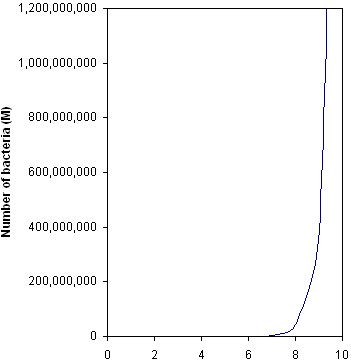
a. being characteristic of exponential growth.
b. being characteristic of arithmetic growth.
c. an S-shaped curve.
d. a J-shaped curve.
e. being a J-shaped curve characteristic of exponential growth.
E
You might also like to view...
What human organ is formed from two genetically-different tissues?
A. neural crest B. neural tube C. placenta D. uterus
Which disease results from deletion of the ?-globin gene cluster LCR?
A) sickle-cell disease B) mild ?-thalassemia C) severe ?-thalassemia D) mild ?-thalassemia E) severe ?-thalassemia
The foramen ovale is a large opening in the occipital bone through which the spinal cord passes
Indicate whether the statement is true or false
Which of the following methods may introduce foreign DNA into a recipient?
A) transformation
B) transduction
C) conjugation
D) transformation, transduction, and conjugation