Solve.Suppose that a polynomial function is used to model the data shown in the graph below.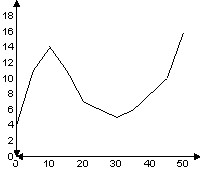 For what intervals is the function increasing?
A. 0 through 10 and 30 through 50
B. 0 through 10 and 40 through 50
C. 0 through 20 and 30 through 50
D. 0 through 50
Answer: A
You might also like to view...
Provide an appropriate response.True or False? The slope is defined as the amount that the graph rises horizontally for a given distance that it runs vertically.
A. True B. False
Explain why the indicated triangles are congruent.?LMO ? ?NOM and ?LOM ? ?NMO. Explain why ?LMO ? ?NOM.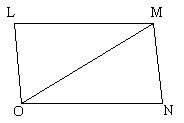
What will be an ideal response?
Find the domain of the composite function f?g. Write the domain in interval notation.f(x) = x + 3, g(x) = 
A. (-?, -9) ? (-9, ?) B. (-?, ?) C. (-?, -6) ? (-6, ?) D. (-?, -6) ? (-6, -3) ? (-3, ?)
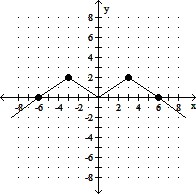
The graph of the function f is shown below. Match the function g with the correct graph.g(x) = -  f(x)
f(x)
A. 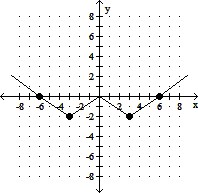
B. 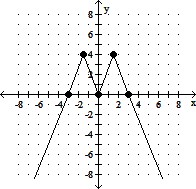
C. 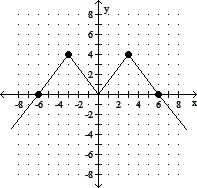
D.