Based on the figure below. Starting from long-run equilibrium at point C, a tax increase that decreases aggregate demand from AD1 to AD will lead to a short-run equilibrium at point ________ and eventually to a long-run equilibrium at point ________, if left to self-correcting tendencies.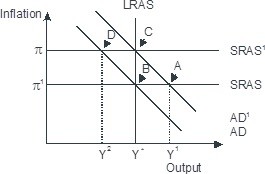
A. D; C
B. D; B
C. A; B
D. B; C
Answer: B
You might also like to view...
Negative relationships are also referred to as inverse relationships
Indicate whether the statement is true or false
The data in the table above shows the consumption by families in a small (poor) economy. The families consume only salt and bread. The reference base period is 2011. The cost of the CPI market basket in 2010 is
A) $52.00. B) $5.00. C) $64.00. D) $8.50. E) unable to be calculated because information is needed about the quantities purchased in 2010.
Refer to Scenario 12.2. If each player plays an ideal mixed strategy, then both will donate a kidney about ________ of the time
A) 6.25% B) 12.5% C) 37.5% D) 50%
The distinguishing feature that determines whether an analysis is classical or Keynesian is
A) the speed of price adjustment. B) the slope of the aggregate demand curve. C) the degree of monopoly power in the economy. D) the assumption about the transmission mechanism of monetary policy.