This graph depicts a tax being imposed, causing demand to shift from D1 to D2. According to the graph shown, the tax caused:
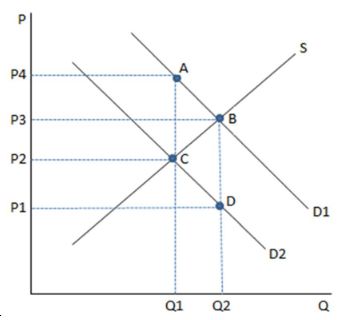
A. positive government revenue and decreased consumption.
B. zero government revenue and decreased consumption.
C. a transfer of revenue to surplus and increased consumption.
D. positive government revenue and increased consumption.
A. positive government revenue and decreased consumption.
You might also like to view...
As more people started using fax machines, fax machines became more valuable to individual users. This is an example of a(n) ________
A) moral hazard B) adverse selection C) network externality D) negative externality
The lower the tax rate, the ________ the after-tax profits and the ________ the after-tax net present value of an investment.
A) higher; higher B) lower; lower C) higher; lower D) lower; higher
A telecommunication company divided into different divisions for residential and business Internet service is an example of
a. An M-form of an organization b. A functional organization c. An N-form organization d. All of the above
If the multiplier is 3, equilibrium real GDP is $1,000 billion, and investment is $400 billion, what will happen if investment decreases to $380 billion? Real GDP will:
a. increase to $1,020 billion. b. increase to $1,060 billion. c. decrease to $980 billion. d. decrease to $940 billion. e. decrease to $970 billion.