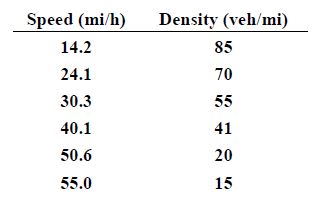
The data shown below were obtained by time-lapse photography on a highway. Use regression analysis to fit these data to the Greenshields model and determine (a) the mean free speed, (b) the jam density, (c) the capacity, and (d) the speed at maximum flow.
What will be an ideal response?
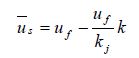
A linear regression analysis can be applied to the given data to estimate parameters in Greenshields’ model of traffic flow. Greenshields’ model (Equation 6.20) is:
A linear regression model takes the form y = a + bx; therefore, in this case, the
given data us and k correspond to y and x respectively. The linear regression
analysis can be performed using equations 6.21, 6.22, and 6.23, or using a
computer software spreadsheet package. Linear regression analysis yields values
of a = 62.8124 and b = –0.56845. Therefore,
a) Mean free flow speed, uf = a = 62.8 mi/h
b) Jam density, kj
In the regression model, b = uf / kj
b = 0.56845
kj = 62.8 / 0.56845 = 110.49
kj = 110 veh/mi
c) Capacity, qmax
Capacity occurs at maximum flow. State flow in terms of density.
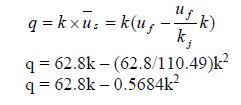
Take the derivative and set equal to zero to maximize flow; solve for density.
density.
0 = 62.8 – 1.1368k
k = 55.25 when q = qmax
Solve for q
qmax = 62.8(55.25) – 0.5684(55.25)2
qmax = 1735 veh/h
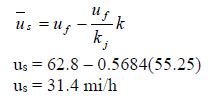
d) Speed at maximum flow
Solve for mean speed using k when q = qmax
You might also like to view...
Egyptians used beautifully decorated vases, bowls, and jars to hold ____________________ or ____________________
Fill in the blank(s) with correct word
Which two pieces of information should be on the sketches regarding the person who prepared them?
What will be an ideal response?
Resistance will be measured with a:
a. ammeter b. flowmeter c. Ohmmeter d. voltmeter
When the oxygen sensor begins to produce a useable signal the PCM enters ________ operation
A) Closed loop B) Warm-up C) Open loop D) Backup