 According to the graph shown, the equilibrium price is:
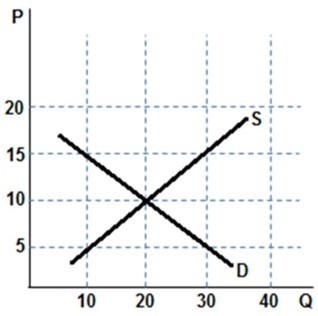
A. $5
B. $15
C. $20
D. $10
Answer: D
You might also like to view...
The production function shows that potential GDP increases when the
A) price level rises. B) price level falls. C) inflation rate falls. D) quantity of labor employed increases. E) the wage rate falls.
Brinley Thomas (1954) argues that immigrants were attracted to the United States between 1815 and 1914 for all of the following reasons except
(a) Harvest failures in the home countries of the immigrants (b) Organized labor opportunities, health benefits, safe working conditions and healthy work environments in the U.S. (c) European population increases, contributing to problems associated with more mouths to feed in a stagnant European economy (d) Increasing job opportunities in an expanding U.S. economy
A risk neutral individual
a. Values a lottery at more than its expected value b. Values a lottery at less than its expected value c. Values a lottery at its expected level d. Tends to play a lot of lotteries
Suppose that the percentage change in demand is 10%, the price elasticity of demand is 2, and the price elasticity of supply is 2. The equilibrium price will:
A. decrease by 2.5 percent. B. increase by 40 percent. C. increase by 2.5 percent. D. decrease by 40 percent.