Use a graphing utility to graph the function over the indicated interval and approximate any local maxima and local minima. Determine where the function is increasing and where it is decreasing. If necessary, round answers to two decimal places.f(x) = -0.3x3 + 0.2x2 + 4x - 5; (-4, 5)
A. local maximum at (-1.9, -9.82)
local minimum at (2.34, 1.61)
increasing on [-1.9, 2.34]
decreasing on [-4, -1.9] and [2.34, 5]
B. local maximum at (2.34, 1.61)
local minimum at (-1.9, -9.82)
increasing on [-4, -1.9] and [2.34, 5]
decreasing on [-1.9, 2.34]
C. local maximum at (2.34, 1.61)
local minimum at (-1.9, -9.82)
increasing on [-1.9, 2.34]
decreasing on [-4, -1.9] and [2.34, 5]
D. local maximum at (-1.9, -9.82)
local minimum at (2.34, 1.61)
increasing on [-4, -1.9] and [2.34, 5]
decreasing on [-1.9, 2.34]
Answer: C
You might also like to view...
How many more pet cats are there than pet dogs? Is it possible to use bar graphs in this case?
A. True B. False
Use regression to find a power model for the following data table. Then plot the data along with the graph of the power regression model. Use two digits of accuracy for the coefficient and for the power. x 1.34 1.825 2.495 4.065 6.055 y 3.71 6.24 9.71 20.73 43.07
What will be an ideal response?
Determine the indefinite integral. Check your work by differentiation.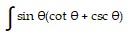 d?
d?
A. sin ? + ? + C B. sin ? + C C. cos ? + C D. csc ? + cos ? + C
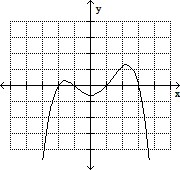
Pick which graph satisfies the given conditions.Degree 4 with 4 x-intercepts and a negative leading coefficient.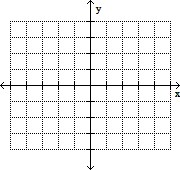
A. 
B. 
C. 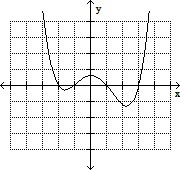
D.