The diagram suggests that:
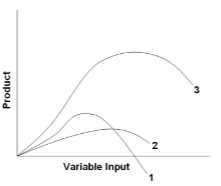
A. when marginal product is zero, total product is at a minimum.
B. when marginal product lies above average product, average product is rising.
C. when marginal product lies below average product, average product is rising.
D. when total product is at a maximum, so are marginal product and average product.
B. when marginal product lies above average product, average product is rising.
You might also like to view...
New classical economists
a. accept the monetarist notion that markets are perfectly competitive except for a lack of perfect information. b. do accept the difference between the short-run and long-run results in the monetarist analysis of the effects of aggregate demand on output and employment. c. accept the difference between the short-run and long- run results in the Keynesian analysis of the effects of aggregate demand on output and employment, but not in the monetarist analysis. d. accept the difference between the short-run and long-run results in the monetarist analysis of the effects of aggregate demand on output and employment, but not in the Keynesian analysis. e. Both a and b
Since most firms use a stable markup, prices will remain stable over long periods of time
a. True b. False
Total utility can be calculated as the
a. difference between all marginal utilities b. price paid for one good c. sum of all marginal utilities d. total expenditure on all units of the good the consumer buys e. difference between the marginal utilities of the first and last units
If households and firms expect higher rates of inflation, the ________ curve will shift ________.
A. SRAS; upward B. AD; until it becomes vertical C. SRAS; downward D. AD; rightward