Refer to Figure 1-1. Using the information in the figure above, calculate the percentage change in sales of alcoholic beverages between 2008 and 2011.
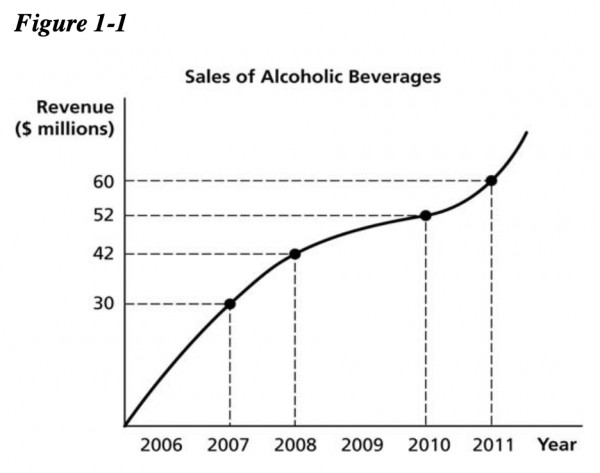
A) 23.1%
B) 23.8%
C) 30%
D) 42.9%
Correct answer is D) 42.9%
You might also like to view...
What is an efficient way to study for an economics exam?
A) Attend every lecture and take copious notes. B) Read the assigned material once before each class and once after. C) Form study sessions with others in class. D) Put off everything and instead cram the night before the exam. E) Any of the above might be efficient, depending on one's perceived costs and benefits.
In the figure above, if the interest rate is 8 percent, people demand $0.1 trillion
A) less money than the quantity supplied and the interest rate will rise. B) less money than the quantity supplied and the interest rate will fall. C) more money than the quantity supplied and the interest rate will fall. D) more money than the quantity supplied and the interest rate will rise.
A 10 percent increase in income increases the quantity of orange juice demanded from 19,200 to 20,800 gallons. The income elasticity of demand for orange juice is
A) 0.5. B) 0.8. C) 1.0. D) 1.2.
Figure 29-1
?
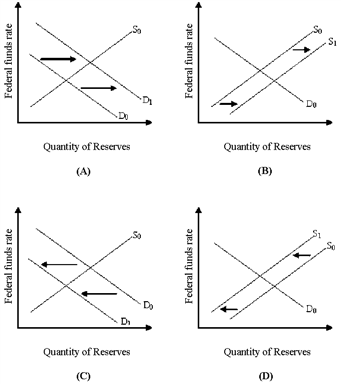 In Figure 29-1, which panel shows the effect of a recession on the interest rate?
A. Panel (A) B. Panel (B) C. Panel (C) D. Panel (D)