The following graph shows the populations of the metropolitan areas of City X and City Y over six years.  At the time when the populations of the two metropolitan areas were equal, what was the approximate population of each area?
A. about 1.03 million
B. about 0.87 million
C. about 0.92 million
D. about 0.95 million
Answer: B
You might also like to view...
Determine whether the system corresponding to the given augmented matrix is dependent or inconsistent. If it is dependent, give the solution.
A. inconsistent B. dependent; (5, 2) C. dependent; (-5, -2, 10) D. dependent; (-5, -2)
Solve the problem.The table lists the percentage y of high school seniors that had used a certain drug within the previous month in a certain city for various years x. In this table  corresponds to 1975 and x = 20 to 1995.
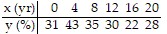 Determine whether a linear, quadratic, cubic, or quartic polynomial best fits this data.
A. Linear B. Quadratic C. Cubic D. Quartic
Write the decimal point in the correct location. 663.59 × 10 = 663590
A. 66,359.0 B. 663.590 C. 663,590. D. 6635.90
Describe how to obtain the graph of the given monomial function from the graph of g(x) = xn with the same power n.f(x) =  x8
x8
A. Vertically shrink by a factor of  , and then reflect across y-axis
B. Vertically shrink by a factor of 
C. Vertically shrink by a factor of  , and then reflect across x-axis
D. Horizontally shrink by a factor of 