Figure36-8
?
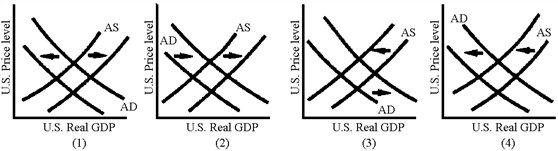
Which of the graphs in Figure 36-8 illustrates the AD–AS shifts induced by the foreign sector following an increase in the U.S. federal deficit?
A. 1
B. 2
C. 3
D. 4
Answer: A
You might also like to view...
Foreign investment is considered direct only when
a. the foreign firm owns what is considered a controlling interest b. the foreign firm owns at least 50.1 percent of the company c. all foreign stockholders together own at least forty percent of the company d. the foreign firm has control of key patents e. none of the above
When a country has a current account deficit, the country
A) is borrowing from abroad. B) is lending abroad. C) must have a government budget surplus. D) must have a government budget deficit.
The distribution of income
a. is about the same in most countries b. tends to be more equal in developing countries than in developed countries c. is more concentrated in the United States than in Canada or Japan d. is more even in developing countries than in the Russia e. is not related to a country's level of development
The coupon rate on newly issued bonds is usually higher for bonds with ________ terms and ________ risk that the borrower will go bankrupt.
A. longer; greater B. shorter; smaller C. shorter; greater D. longer; smaller