What can you conclude by comparing the left and right hydrographs, each of which depict the same amount of time?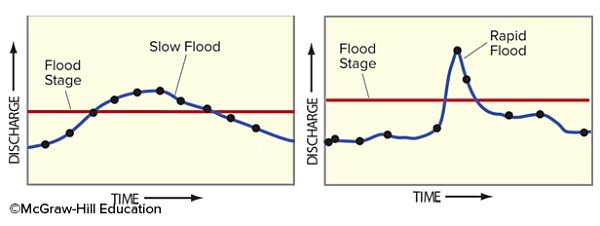
A. The left diagram has a higher peak discharge.
B. Neither graph shows a true flood.
C. The right diagram represents a quicker event, like a flash flood.
D. None of these choices are correct.
Answer: A
You might also like to view...
In the figure of an ecosystem, choose which of the components are categorized as biotic
What will be an ideal response
What numeric data type will you use to store values like 321456, 678456, and 912567?
A. Double-precision float B. Single-precision float C. Long integer D. Short integer
Subtropical highs are
A) permanent. B) regions of major precipitation. C) also called cyclones. D) stationed over the horse latitudes. E) found at about 40 degrees north and south of the equator.
Global Positioning Systems reference ________ location
A) relative B) situational C) mathematical D) toponymic E) only military