Discuss some of the government regulations designed to ensure depositors’ safety and to control the money supply.
What will be an ideal response?
Deposit insurance: The principal innovation that guarantees the safety of bank deposits is deposit insurance. Most of the U.S. bank deposits are insured against loss by the Federal Deposit Insurance Corporation (FDIC)—an agency of the federal government.Bank supervision: Various regulatory authorities conduct periodic bank examinations to keep tabs on the financial conditions and business practices of the banks under their purview. After a rash of bank failures in the late 1980s and early 1990s, the U.S. bank supervision was tightened by legislation that permits the authorities to intervene early in the affairs of financially troubled banks. The 2007–2009 financial crisis led to the passage of the Dodd-Frank Act, which empowered the Federal Reserve to supervise financial institutions deemed to be systemically important and subject these institutions to a more stringent regulatory regime than other banks.Reserve requirements: A final type of regulation also has some bearing on safety but is motivated primarily by the government’s desire to control the money supply. The amount of money any bank will issue depends on the amount of reserves it elects to keep. For this reason, most banks are subject by law to minimum required reserves.
You might also like to view...
The difference between a bank's assets and liabilities is referred to as:
A) retained earnings. B) gross profits. C) stockholders' equity. D) net profits.
Retail stores that dedicate one or more aisles to "seasonal" items are engaging in ________
A) just-in-time production B) production smoothing C) work in process D) first degree price discrimination
If nominal GDP increased from $5,000 billion in 2010 to $5,500 billion in 2011 and the GDP deflator increased from 130 to 140 over the same time period, what would the 2011 real GDP equal expressed in terms of 2010 dollars?
a. $4,643 billion b. $5,107 billion c. $5,385 billion d. $5,500 billion
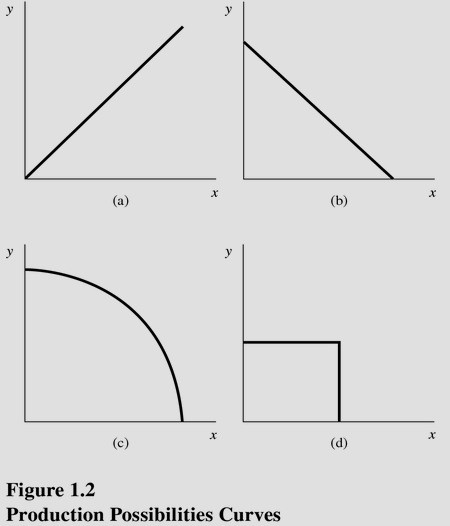 Choose the letter of the curve in Figure 1.2 that best represents a production possibilities curve for two goods that obey the law of increasing opportunity costs:
A. A. B. B. C. C. D. D.