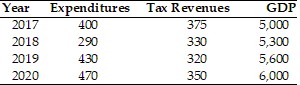
 Suppose that initially there is no public debt. Using the above table, what is the public debt as a percentage of GDP in 2019?
A. 7.7 percent
B. 1.7 percent
C. 5.9 percent
D. 2.0 percent
Answer: B
You might also like to view...
What are the three monetary policy tools of the Fed? Briefly describe how each tool can be used to implement an expansionary monetary policy and a contractionary monetary policy
What will be an ideal response?
Witness the 1970s. Supply shocks such as the dramatic oil price increase explain
a. the fall in unemployment that occurred at the expense of stable prices b. the shift to the right of the aggregate demand curve c. what caused price levels and real GDP to increase d. why stagnation occurred e. why taxes, government spending, private consumption and investment increased
Figure 36-7
?
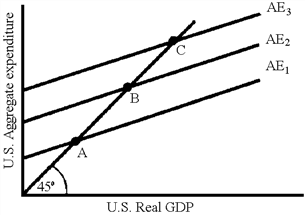 In Figure 36-7, there are three aggregate expenditure functions (C + I + G + X? IM) for an open economy. Which of the following would cause a movement from A to B?
A. a European economic expansion B. A decrease in the money supply C. An increase in the interest rate D. An increase in the U.S. price level
Using the income approach, net interest is included because
A. households both receive and pay interest. B. households pay but do not receive interest and firms receive but do not pay interest. C. firms pay but do not receive interest and households receive but do not pay interest. D. it is income to the government but not to households nor firms.