The figure above shows the market for milk. When the efficient quantity of milk is produced, the marginal social benefit from the last gallon is
A) $2.00.
B) $2.50.
C) $3.00.
D) $3.50.
C
You might also like to view...
A model comparing savings and foreign exchange constraints to see which is binding for economic growth is known as a
(a) project appraisal. (b) two gap model. (c) computable general equilibrium. (d) trickle down model. (e) none of the above.
As a general rule, a recession is a decline in real GDP lasting at least:
a. one year. b. six months. c. three months. d. one month.
The reason unemployment claims are a good leading indicator of economic activity is that they reflect
A. Industry layoffs and hiring. B. Automatic stabilizers. C. Orders for new goods. D. Hours worked per week.
Exhibit 21-1 Production possibilities curves
?
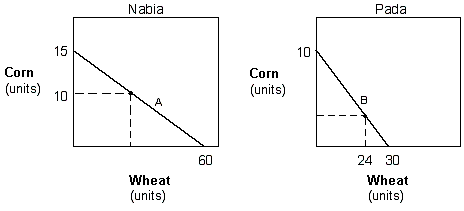 In Exhibit 21-1, the production possibilities curves of wheat and corn for Nabia and Pada are presented. In Nabia the cost of producing one more unit of wheat is equal to:
A. 4 units of corn. B. 4 units of wheat. C. 1/4 unit of corn. D. 15 units of corn.